When a transformer experiences extreme stress from a short circuit or a rough transit, its internal geometry can be compromised. Windings can shift, clamp pressure can be lost, and core structures can be damaged. While a short-circuit impedance test can suggest a problem exists, Sweep Frequency Response Analysis (SFRA) is the definitive, non-invasive test that provides a detailed picture of the transformer’s mechanical and electrical condition.
For the field engineer, understanding the principles of SFRA is essential for diagnosing complex issues and making critical decisions about a transformer’s serviceability.
What is SFRA and How Does It Work?
Imagine sending a sound wave through an object and listening to the echo. The echo’s pattern would be unique to that object’s physical structure. SFRA works on a similar principle, but uses electrical signals instead of sound.
The process involves:
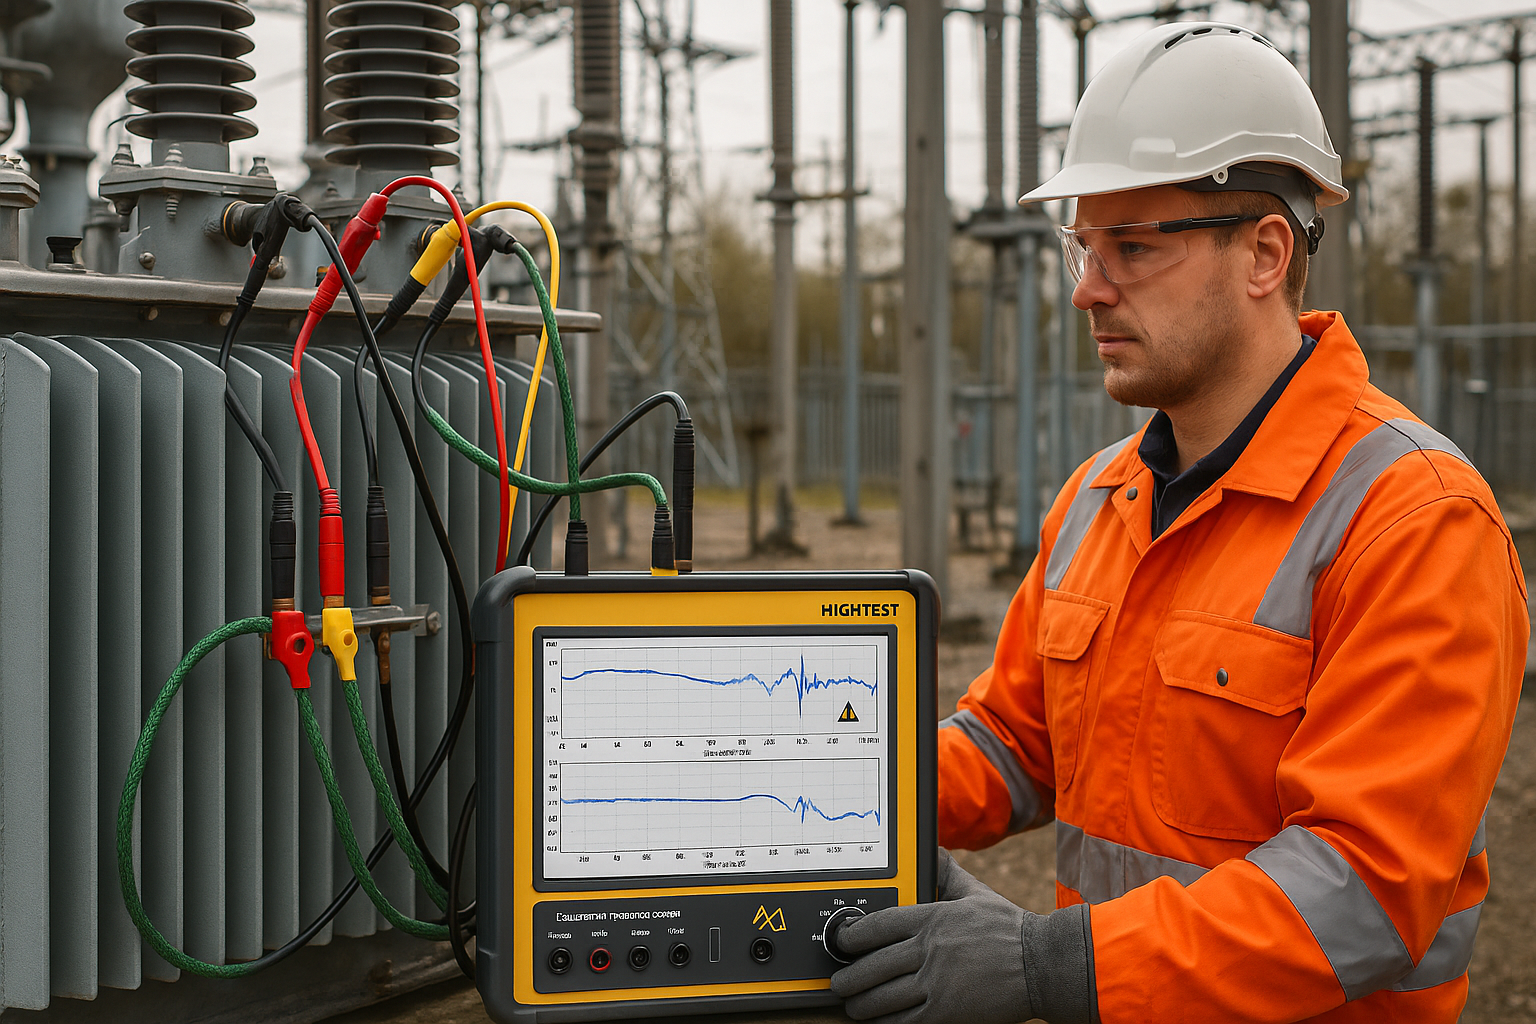
- Injecting a low-voltage sinusoidal signal with a continuously varying frequency (from a few Hz up to several MHz) into one transformer terminal.
- Measuring the signal that comes out at another terminal.
- Plotting the ratio of the output signal to the input signal over the entire frequency range.
The resulting graph is the transformer’s unique “fingerprint.” A healthy transformer will have a specific, repeatable frequency response curve. Any deviation from this baseline fingerprint indicates a change in the transformer’s internal R-L-C (Resistance-Inductance-Capacitance) network, which is directly tied to its physical structure.
Why is SFRA So Powerful?
A transformer’s response varies across different frequency ranges, with each range corresponding to specific internal components:
- Low-Frequency Range (< 2 kHz): The response in this band is dominated by the core and its magnetic properties. Problems like shorted laminations, core grounding issues, or open circuits in the windings will show up here.
- Mid-Frequency Range (2 kHz to 200 kHz): This range is highly sensitive to the bulk winding inductance. It is the primary region for detecting significant winding deformations, such as axial or radial shifts between the high-voltage (HV) and low-voltage (LV) windings.
- High-Frequency Range (> 200 kHz): This area reflects the inter-turn capacitance and local inductances within the windings. It is excellent for detecting more subtle problems like turn-to-turn shorts, localized winding displacements, and issues with internal leads and connections.
The Golden Rule: Comparison is Everything
An SFRA trace on its own is meaningless. Its diagnostic power comes from comparison:
- Time-Based Comparison (Fingerprint vs. Now): The most powerful method is comparing the current test result against a baseline fingerprint taken when the transformer was known to be in good condition (e.g., at the factory or after commissioning). A perfect match means no mechanical change has occurred.
- Phase-to-Phase Comparison: In a three-phase transformer, the outer phases (e.g., Phase A and C) should have very similar SFRA traces due to their symmetrical construction. The center phase will be slightly different. A significant deviation between two symmetrical phases points to a problem.
- Type-Based Comparison: Comparing the results with a “sister” transformer of the exact same design can also be a valid, though less precise, method of analysis.
Conclusion
SFRA is no longer a niche, specialist-only test. It is a fundamental part of modern transformer diagnostics. For technicians and engineers, it provides an unparalleled, non-invasive view of the transformer’s internal mechanical health. By understanding how to interpret its results, you can identify hidden damage and make informed, proactive maintenance decisions, preventing minor issues from escalating into major failures.